
Photo Credit: fizkes / Shutterstock
Much of the housing market made a forced pit stop during the COVID-19 lockdowns of March 2020, but by that summer it was on track and running red hot. The upswing ran contrary to conventional wisdom, and the pandemic-related lull in home sales that some experts expected never materialized. The opposite happened; both mortgage applications and home sales in the U.S. increased in 2020, exceeding those of the pre-pandemic year prior by considerable margins in many locales.
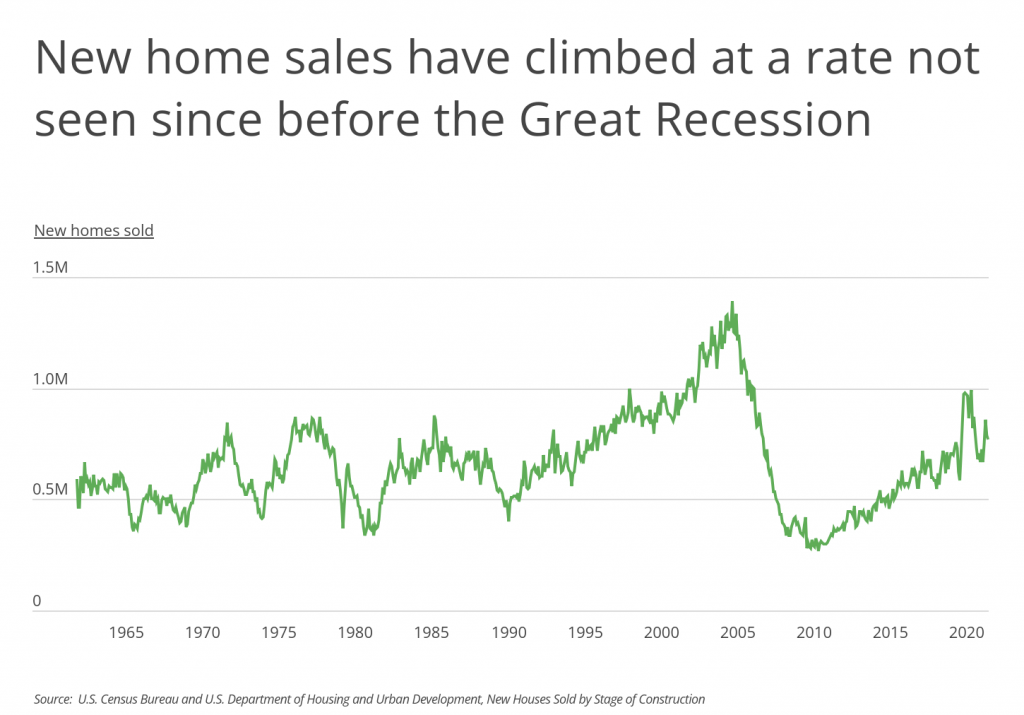
Data from the National Association of Realtors shows that while COVID-19 put a dent in the first-quarter homes sales of 2020, the rebound was enough to top 2019 numbers; existing-home sales in 2020 were up 5.6% over 2019. Data from the Census Bureau shows a similar trend for new home sales, which dropped sharply in March and April of 2020 before rising sharply at the end of 2020 and then recovering to more normal levels in 2021. This atypical jump in home sales—noteworthy at any time, much less during a pandemic—was driven in part by historically low interest rates, and the fact that all signs said these rates would go up in the near future.
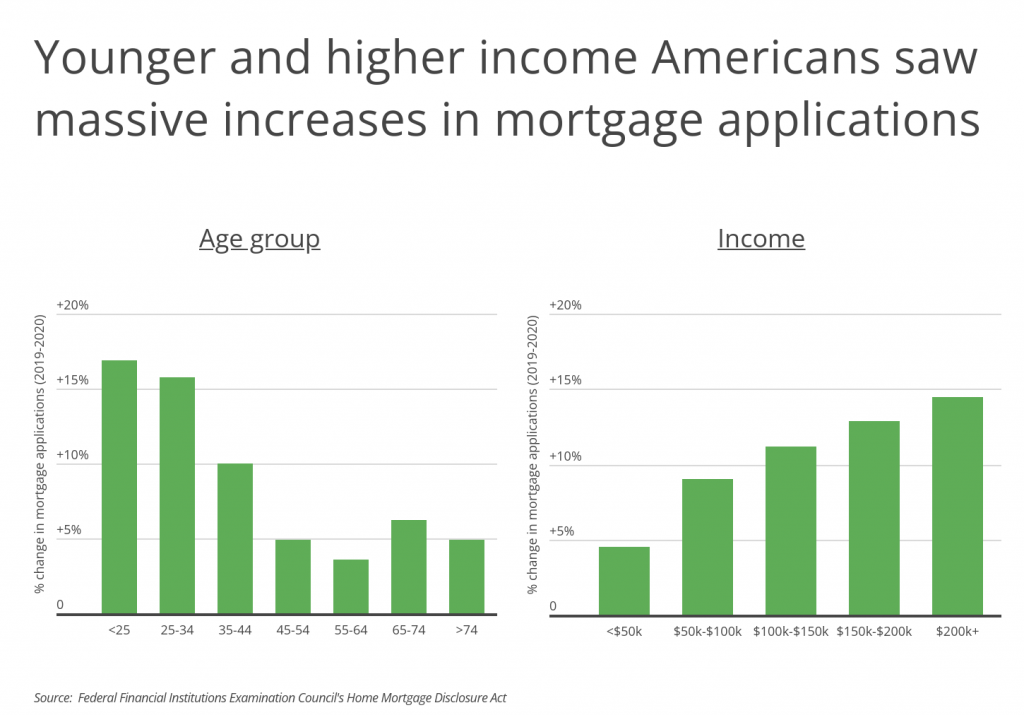
Another factor was that a new cohort of homebuyers entered the market, thanks to telecommuting. According to Zillow, the pandemic helped to create nearly two million new potential homebuyers in 2020; renters who worked in metropolitan areas where housing costs are high were suddenly free to live in areas where they could afford homes. Around half of these new telecommuters were Millennials between the ages of 26 and 40, in their prime years for starting families and buying homes. This work-from-home trend looks to be continual and, in many cases, permanent. Gallup data shows that in September 2021, 45% of full-time employees worked fully or partly remotely. That percentage increased to 67% among white-collar workers, with 41% of that group reporting that they worked exclusively from home. And nine out of 10 remote workers said they anticipate working remotely going forward.
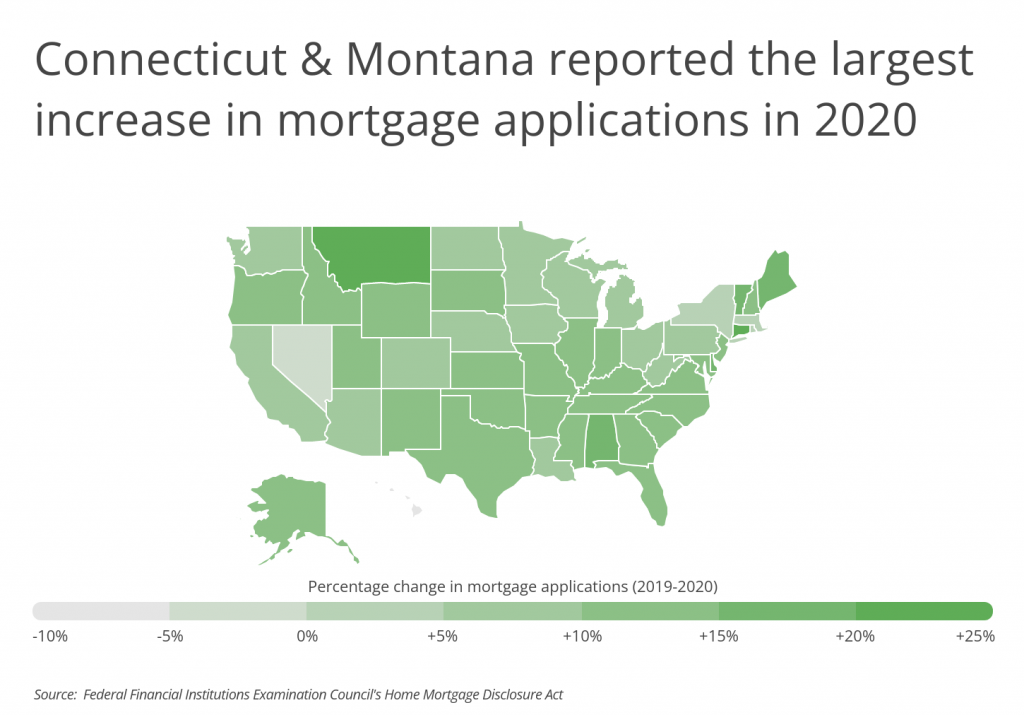
Inextricably linked, home sales and home mortgage applications followed similar trend lines over the course of 2020: both went up. Nationally, from 2019 to 2020, there was a 9.0% increase in mortgage applications. At the state level, a significant number of Northeast locales far outpaced the national average, including Connecticut with a 24.9% rise in mortgage applications, Vermont (+18.5%), Maine (+18.3%), Delaware (+16.9%), and New Jersey (+12.8%). Additionally, mountain states such as Montana, Utah, and Idaho also reported sharp jumps in mortgages in 2020.
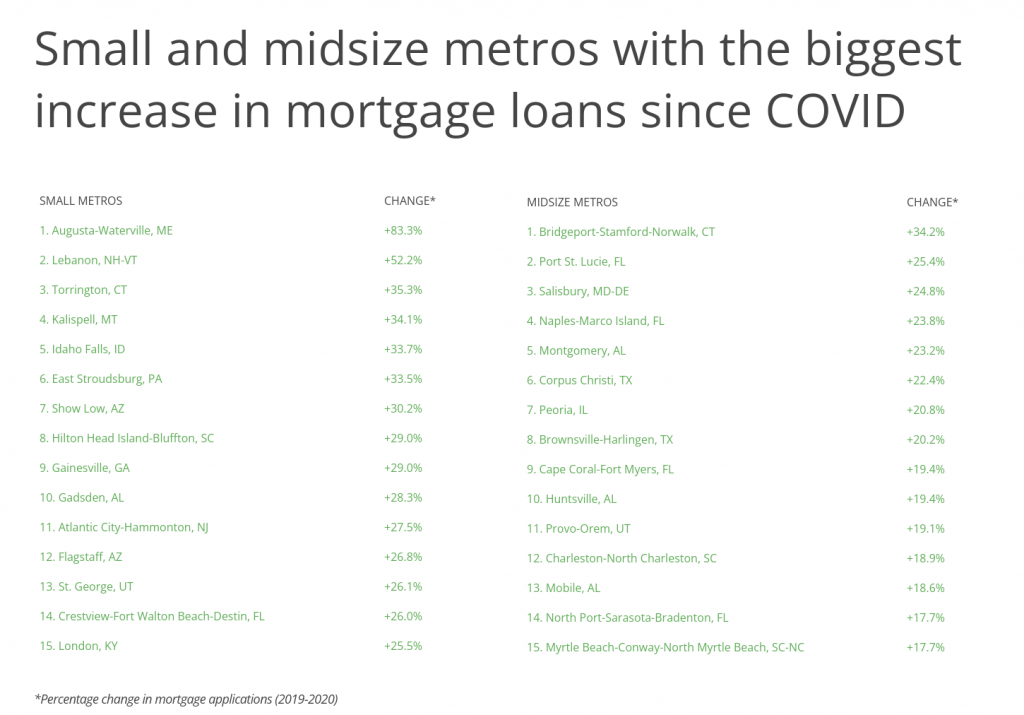
These trends extend to the local level. The Northeastern metropolitan areas of Augusta-Waterville, ME, Lebanon, NH, East Stroudsburg, PA, as well as the Connecticut metropolises of Torrington and Bridgeport reported some of the largest increases in mortgage applications at the local level. Similarly, the Mountain state locations of Kalispell, MT and Idaho Falls, ID experienced greater than 30% increases year over year.
The data used in this analysis is from the Federal Financial Institutions Examination Council’s Home Mortgage Disclosure Act. Only conventional, home purchase loans were considered. To determine the locations with the biggest increase in mortgage loans since COVID-19, researchers at Inspection Support Network calculated the percentage change in mortgage applications from 2019 to 2020.
Here are the U.S. metropolitan areas with the biggest increases in mortgage loans since COVID-19.
Large Metros With the Biggest Increase in Mortgage Loans Since COVID-19

Photo Credit: CHARLES MORRA / Shutterstock
15. Jacksonville, FL
- Percentage change in mortgage applications (2019-2020): +10.9%
- Total change in mortgage applications (2019-2020): +2,151
- Total mortgage applications (2020): 21,943
- Total mortgage applications (2019): 19,792
- Mortgage loan approval rate (2020): 85.6%
- Mortgage loan approval rate (2019): 86.0%

Photo Credit: Jon Bilous / Shutterstock
14. Portland-Vancouver-Hillsboro, OR-WA
- Percentage change in mortgage applications (2019-2020): +11.1%
- Total change in mortgage applications (2019-2020): +3,514
- Total mortgage applications (2020): 35,257
- Total mortgage applications (2019): 31,743
- Mortgage loan approval rate (2020): 92.2%
- Mortgage loan approval rate (2019): 92.7%

Photo Credit: f11photo / Shutterstock
13. Dallas-Fort Worth-Arlington, TX
- Percentage change in mortgage applications (2019-2020): +11.1%
- Total change in mortgage applications (2019-2020): +9,214
- Total mortgage applications (2020): 92,310
- Total mortgage applications (2019): 83,096
- Mortgage loan approval rate (2020): 88.4%
- Mortgage loan approval rate (2019): 89.0%
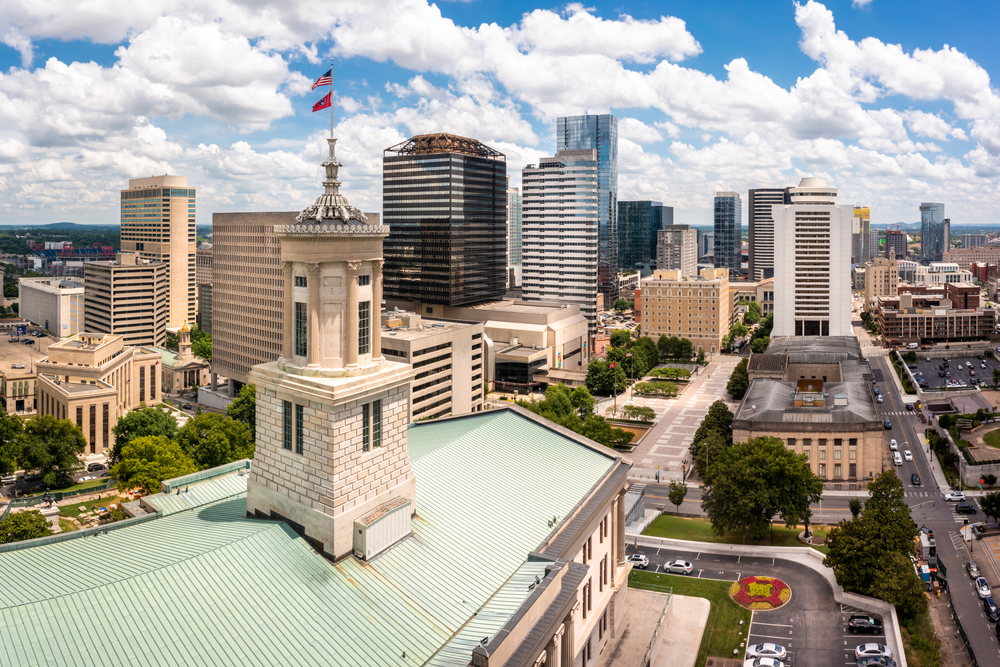
Photo Credit: Mihai_Andritoiu / Shutterstock
12. Nashville-Davidson–Murfreesboro–Franklin, TN
- Percentage change in mortgage applications (2019-2020): +11.2%
- Total change in mortgage applications (2019-2020): +3,274
- Total mortgage applications (2020): 32,464
- Total mortgage applications (2019): 29,190
- Mortgage loan approval rate (2020): 91.2%
- Mortgage loan approval rate (2019): 91.9%

Photo Credit: Sean Pavone / Shutterstock
11. Louisville/Jefferson County, KY-IN
- Percentage change in mortgage applications (2019-2020): +11.3%
- Total change in mortgage applications (2019-2020): +1,694
- Total mortgage applications (2020): 16,746
- Total mortgage applications (2019): 15,052
- Mortgage loan approval rate (2020): 89.5%
- Mortgage loan approval rate (2019): 89.8%

Photo Credit: Andrew Yoshiki / Shutterstock
10. San Antonio-New Braunfels, TX
- Percentage change in mortgage applications (2019-2020): +11.3%
- Total change in mortgage applications (2019-2020): +2,321
- Total mortgage applications (2020): 22,883
- Total mortgage applications (2019): 20,562
- Mortgage loan approval rate (2020): 81.4%
- Mortgage loan approval rate (2019): 82.6%
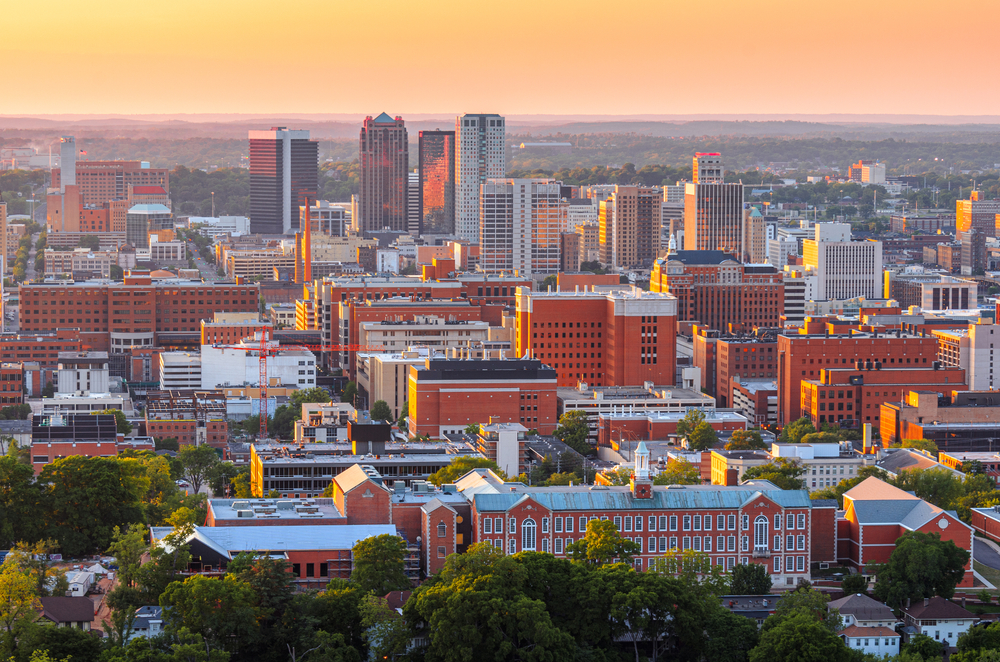
Photo Credit: Sean Pavone / Shutterstock
9. Birmingham-Hoover, AL
- Percentage change in mortgage applications (2019-2020): +12.4%
- Total change in mortgage applications (2019-2020): +1,496
- Total mortgage applications (2020): 13,515
- Total mortgage applications (2019): 12,019
- Mortgage loan approval rate (2020): 86.8%
- Mortgage loan approval rate (2019): 88.8%

Photo Credit: Sean Pavone / Shutterstock
8. Kansas City, MO-KS
- Percentage change in mortgage applications (2019-2020): +12.5%
- Total change in mortgage applications (2019-2020): +3,344
- Total mortgage applications (2020): 30,131
- Total mortgage applications (2019): 26,787
- Mortgage loan approval rate (2020): 93.4%
- Mortgage loan approval rate (2019): 93.3%
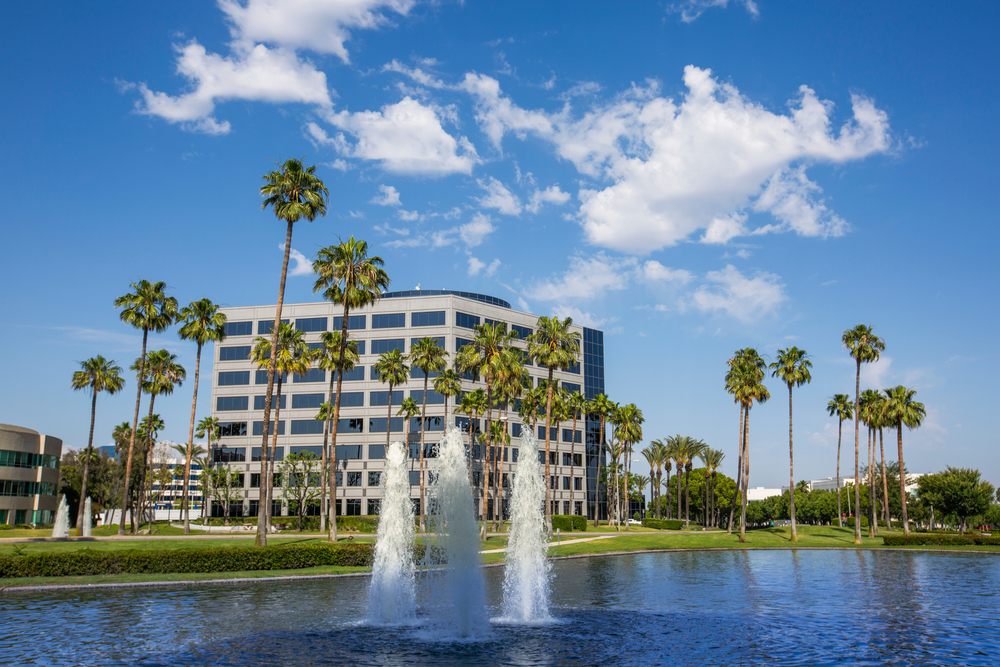
Photo Credit: Matt Gush / Shutterstock
7. Riverside-San Bernardino-Ontario, CA
- Percentage change in mortgage applications (2019-2020): +13.3%
- Total change in mortgage applications (2019-2020): +5,307
- Total mortgage applications (2020): 45,066
- Total mortgage applications (2019): 39,759
- Mortgage loan approval rate (2020): 87.5%
- Mortgage loan approval rate (2019): 88.3%

Photo Credit: Sean Pavone / Shutterstock
6. Oklahoma City, OK
- Percentage change in mortgage applications (2019-2020): +13.4%
- Total change in mortgage applications (2019-2020): +2,005
- Total mortgage applications (2020): 16,952
- Total mortgage applications (2019): 14,947
- Mortgage loan approval rate (2020): 87.9%
- Mortgage loan approval rate (2019): 89.0%

Photo Credit: ShengYing Lin / Shutterstock
5. Austin-Round Rock-Georgetown, TX
- Percentage change in mortgage applications (2019-2020): +13.5%
- Total change in mortgage applications (2019-2020): +4,863
- Total mortgage applications (2020): 40,863
- Total mortgage applications (2019): 36,000
- Mortgage loan approval rate (2020): 88.2%
- Mortgage loan approval rate (2019): 88.9%
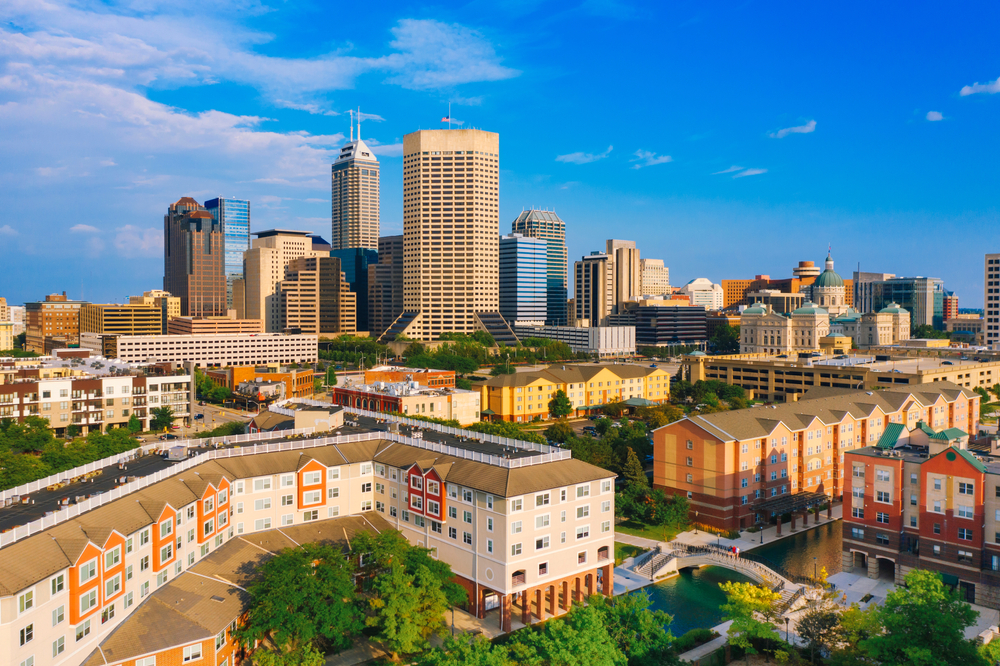
Photo Credit: Agnieszka Gaul / Shutterstock
4. Indianapolis-Carmel-Anderson, IN
- Percentage change in mortgage applications (2019-2020): +13.9%
- Total change in mortgage applications (2019-2020): +3,629
- Total mortgage applications (2020): 29,794
- Total mortgage applications (2019): 26,165
- Mortgage loan approval rate (2020): 92.0%
- Mortgage loan approval rate (2019): 92.5%

Photo Credit: Olivier Le Queinec / Shutterstock
3. Baltimore-Columbia-Towson, MD
- Percentage change in mortgage applications (2019-2020): +14.8%
- Total change in mortgage applications (2019-2020): +3,957
- Total mortgage applications (2020): 30,754
- Total mortgage applications (2019): 26,797
- Mortgage loan approval rate (2020): 91.1%
- Mortgage loan approval rate (2019): 91.1%
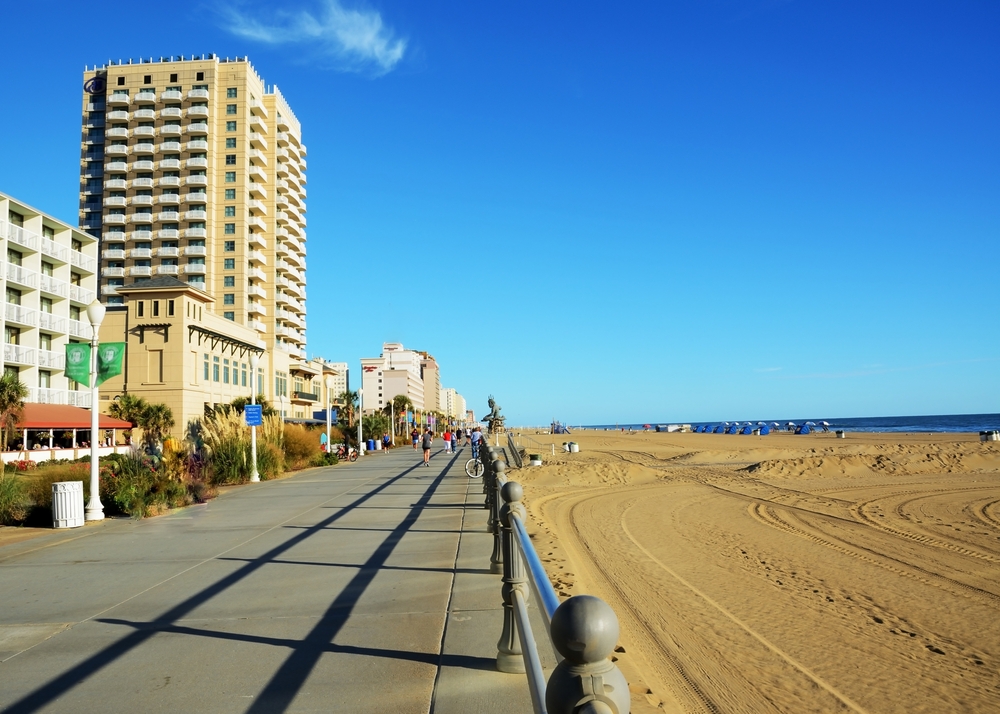
Photo Credit: Alexandr Junek Imaging / Shutterstock
2. Virginia Beach-Norfolk-Newport News, VA-NC
- Percentage change in mortgage applications (2019-2020): +16.6%
- Total change in mortgage applications (2019-2020): +2,373
- Total mortgage applications (2020): 16,673
- Total mortgage applications (2019): 14,300
- Mortgage loan approval rate (2020): 90.8%
- Mortgage loan approval rate (2019): 91.7%
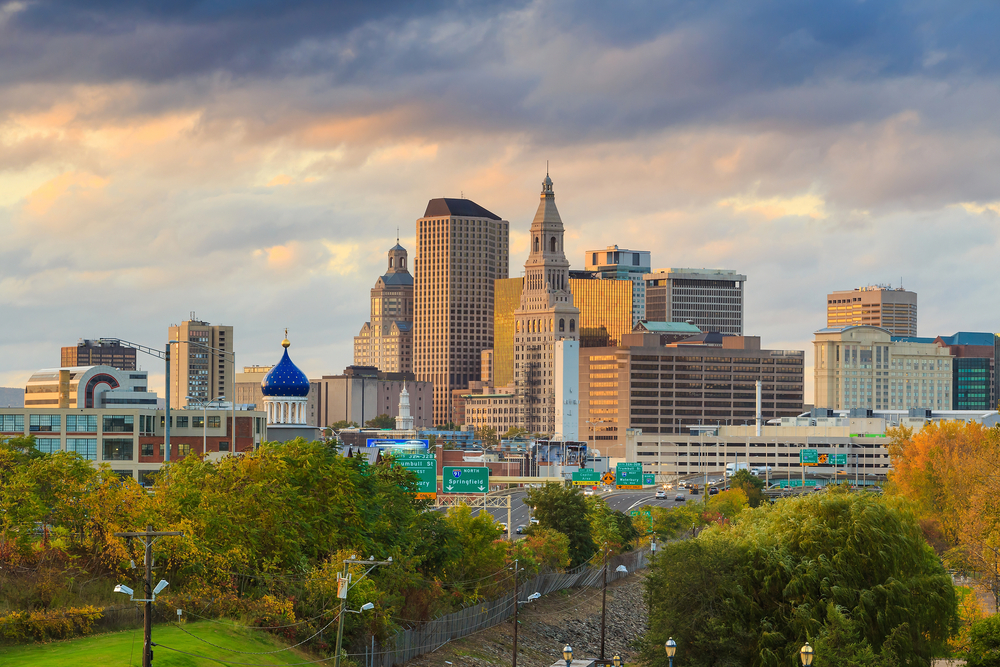
Photo Credit: f11photo / Shutterstock
1. Hartford-East Hartford-Middletown, CT
- Percentage change in mortgage applications (2019-2020): +17.8%
- Total change in mortgage applications (2019-2020): +1,892
- Total mortgage applications (2020): 12,497
- Total mortgage applications (2019): 10,605
- Mortgage loan approval rate (2020): 91.9%
- Mortgage loan approval rate (2019): 91.0%
Methodology & Detailed Findings
The data used in this analysis is from the Federal Financial Institutions Examination Council’s Home Mortgage Disclosure Act. Only conventional, home purchase loans were considered. To determine the locations with the biggest increase in mortgage loans since COVID, researchers calculated the percentage change in mortgage applications from 2019 to 2020. In the event of a tie, the location with the greater total change in mortgage applications from 2019 to 2020 was ranked higher. To improve relevance, only metropolitan areas with at least 100,000 residents were included. Additionally, metros were grouped into cohorts based on population size: small (100,000–349,999), midsize (350,000–999,999), and large (1,000,000 or more).
